Metchecks Magic Number CruncherAdded : Thursday at 11:30 A little look behind the scenes today of how we get weather charts onto the screens which you are looking at.
You probably think that Metcheck is run on a server under Marges' desk? When things go wrong, she gives it a kick and it all seems to work again.
In fact, Metcheck is run on 28 servers. Most of them have a specific role, others are there as a backup in case things fail. The story starts with our ingest servers. These are servers responsible for getting raw weather data from a plethora of sources. Most of the data is in GRIB or Gridded Binary format which we then convert, but more on this later.
The ingest servers periodically head off to ECMWF, NCEP, DWD, Meteo France etc to get the raw data when new runs are available. In an ideal world, all the suppliers would have the same format, same naming system and also run models on time, in the real world this is anything but. So, the ingest servers are designed with error checking and waiting systems in mind, ours looks something like this at most times during the day :-
![]()
The ingest server gets all the timesteps of the models, checks them, checks them again and then once they are fine it sends it across to a main data server which holds all of our weather models so that other servers can access them.
So, we have raw data, but now we need to turn it into images. For this, we have another server cluster which takes the raw data once it's available and then decides which of them turns it into a full global image using Python. This server looks something like this :-
![]()
The images are then created for the full domain for all the variables which you enjoy looking at, but we still aren't there yet... The post processing system waits for the full images and when they are available it loads it and then slices and dices it into the correct images and looks like this :-
![]()
The post processer then uses Python and Vips as well as some other components to monitor the new images available and lets the main servers know where we are in the model run and how long is left.
This process happens 24 hours a day, 365 days a year... Even on Christmas Day! The weather never stops.
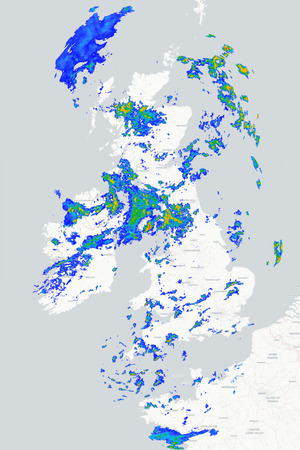
The end result is charts you can enjoy like this :-
![]()
So, when things go wrong sometimes, you can see it can happen at numerous stages. Of course, Marge still kicks her server, but she tends to enjoy that.
Tomorrow, we will look at how we get the raw data into the forecast tables which you see on the site, now that really is magic!
METEOROLOGIST : MARSH |