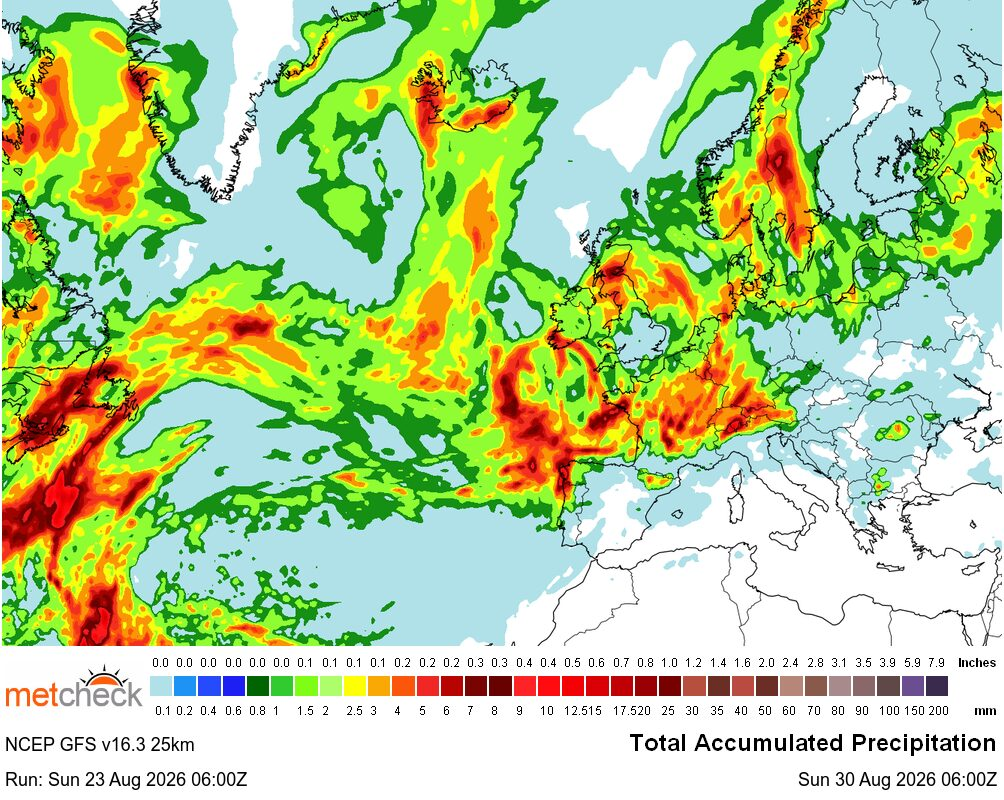
Rainfall UncertaintyAdded : Yesterday at 13:15 Starting today's discussion with the forecast accumulated rainfall out to next weekend, and the latest GFS ► is still showing remarkably little rainfall across some parts of central and southern Britain :-
![]()
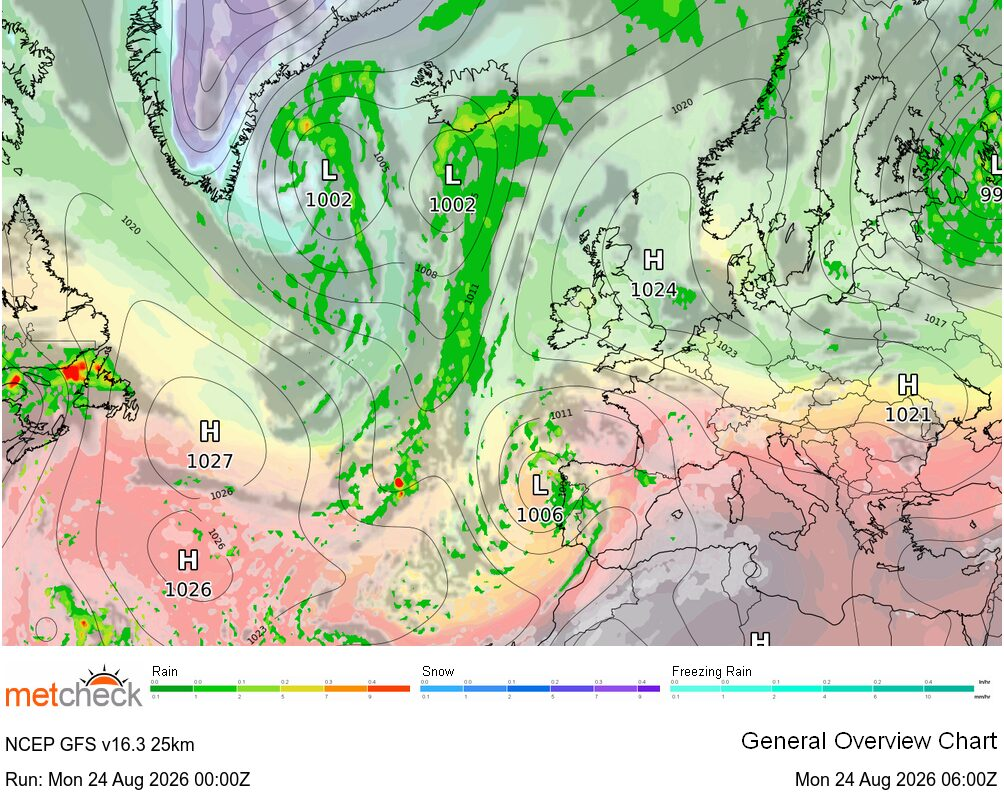
At first glance that might suggest another largely dry week ahead but take a look at the synoptic charts and they tell a rather different story. After a fine and settled start to the week, low pressure is increasingly expected to take control bringing a transition towards more unsettled conditions :-
![]()
The ECMWF ► model is also showing the change towards more unsettled weather but importantly it produces considerably more widespread rainfall across Britain during the same period :-
![]()
So why the difference?
It's a useful reminder not to take accumulated rainfall charts at face value, particularly when looking several days ahead.
These charts show the total precipitation produced at each grid point by one particular run of a forecast model. They can look very precise but that apparent precision can be misleading. A relatively small change in the position or timing of an area of low pressure, weather front or convergence zone can shift the heaviest rainfall by tens or even hundreds of miles.
There is another complication this week because some of the rainfall is expected to be convective in nature with showers and thunderstorms potentially contributing significantly to the totals. Convective rainfall is notoriously difficult for global models to place accurately several days in advance. One location could receive a torrential thunderstorm while somewhere relatively nearby remains largely dry and a global model cannot be expected to resolve that sort of local detail accurately at this range.
That's why the broader synoptic pattern is often more useful than focusing on the exact colours on an accumulated rainfall chart. Both the GFS ► and ECMWF ► are signalling a transition away from the current settled pattern towards lower pressure and an increased risk of showers or longer spells of rain as the week progresses. Exactly where the largest rainfall totals occur remains much less certain.
So while the GFS ► accumulation chart may currently show very little rain for some central and southern areas, it shouldn't be interpreted as a confident forecast of another completely dry week. Instead, the message at this stage is that the risk of rain is increasing considerably but the distribution and totals remain uncertain.
METEOROLOGIST : BARBER | 


 Good afternoon all 😀!! After a clear and sunny start to the day there are a few clouds ...
 Afternoon all...it's more fair than mostly cloudy but it's borderline on & off. It remains...
 Good afternoon folks...
Some high haze and mid-level cumulus again but it's pleasantly wa...
Good afternoon folks...
Some high haze and mid-level cumulus again but it's pleasantly wa...